AI Automation Signals·Updated Jul 6, 2026
Where is AI automation heading?
Think of this page like construction permits for AI automation. Before a building goes up, permits spike. Before AI replaces tasks in an industry, developers start downloading the tools to build those systems. We track 60 automation tools across 10 industries.
AI Automation by Industry
Click any industry to see the full breakdown: tool adoption trends, employment data, and which specific tools are driving growth.
Each industry follows one of three paths: Reduce, Amplify, or Expand.
All Tracked Tools
Click column headers to sort. Surging badges flag tools with sustained rapid growth.
| Tool | Type | Monthly Usage | Monthly Change | 3-Month Trend↓ | Trend |
|---|---|---|---|---|---|
Software & IT13 tools9 surging | 454.8M | +56.3% | +33.9% | ||
Legal & Compliance9 tools3 surging | 163.0M | +86.2% | +24.6% | ||
Finance & Insurance8 tools2 surging | 56.2M | +34.4% | +23.0% | ||
Healthcare4 tools | 9.6M | +22.4% | +38.2% | ||
Creative & Media9 tools3 surging | 34.8M | +50.5% | +25.6% | ||
Customer Service & Support5 tools | 15.3M | +24.0% | +6.8% | ||
Education & Training3 tools | 59.9M | +31.1% | +16.5% | ||
Manufacturing & Logistics5 tools | 66.9M | +27.5% | +14.5% | ||
Sales & Marketing4 tools | 33.3M | +34.4% | +25.6% |
What Happens When Workers Get More Productive?
AI-driven productivity gains lead firms down three paths — often simultaneously. Click each to see the research.
The Productivity J-Curve
Most firms do all three at once. And it takes time — measured productivity often dips before it rises as firms invest in AI tools, reorganize workflows, and retrain workers before reaping the gains. The same pattern played out with electricity and computers.
Brynjolfsson, Rock & Syverson (2021) — NBER Working Paper 24001
Read the full explainerThe automation tools tracked above are the leading indicator. The BLS data tells you which path each industry is taking.
Theoretical Capability vs. Observed Exposure
The gap between what AI could automate and what it actually handles today is enormous. Blue shows the share of tasks LLMs could theoretically perform; red shows measured usage from Claude API traffic. The discrepancy suggests we are still early in the diffusion phase, even in high-exposure categories like Office & Admin and Computer & Math. Importantly, high exposure does not automatically predict displacement. In sectors with elastic demand, high AI exposure may predict expansion — more hiring at higher wages — as productivity gains make previously unviable work economically feasible.
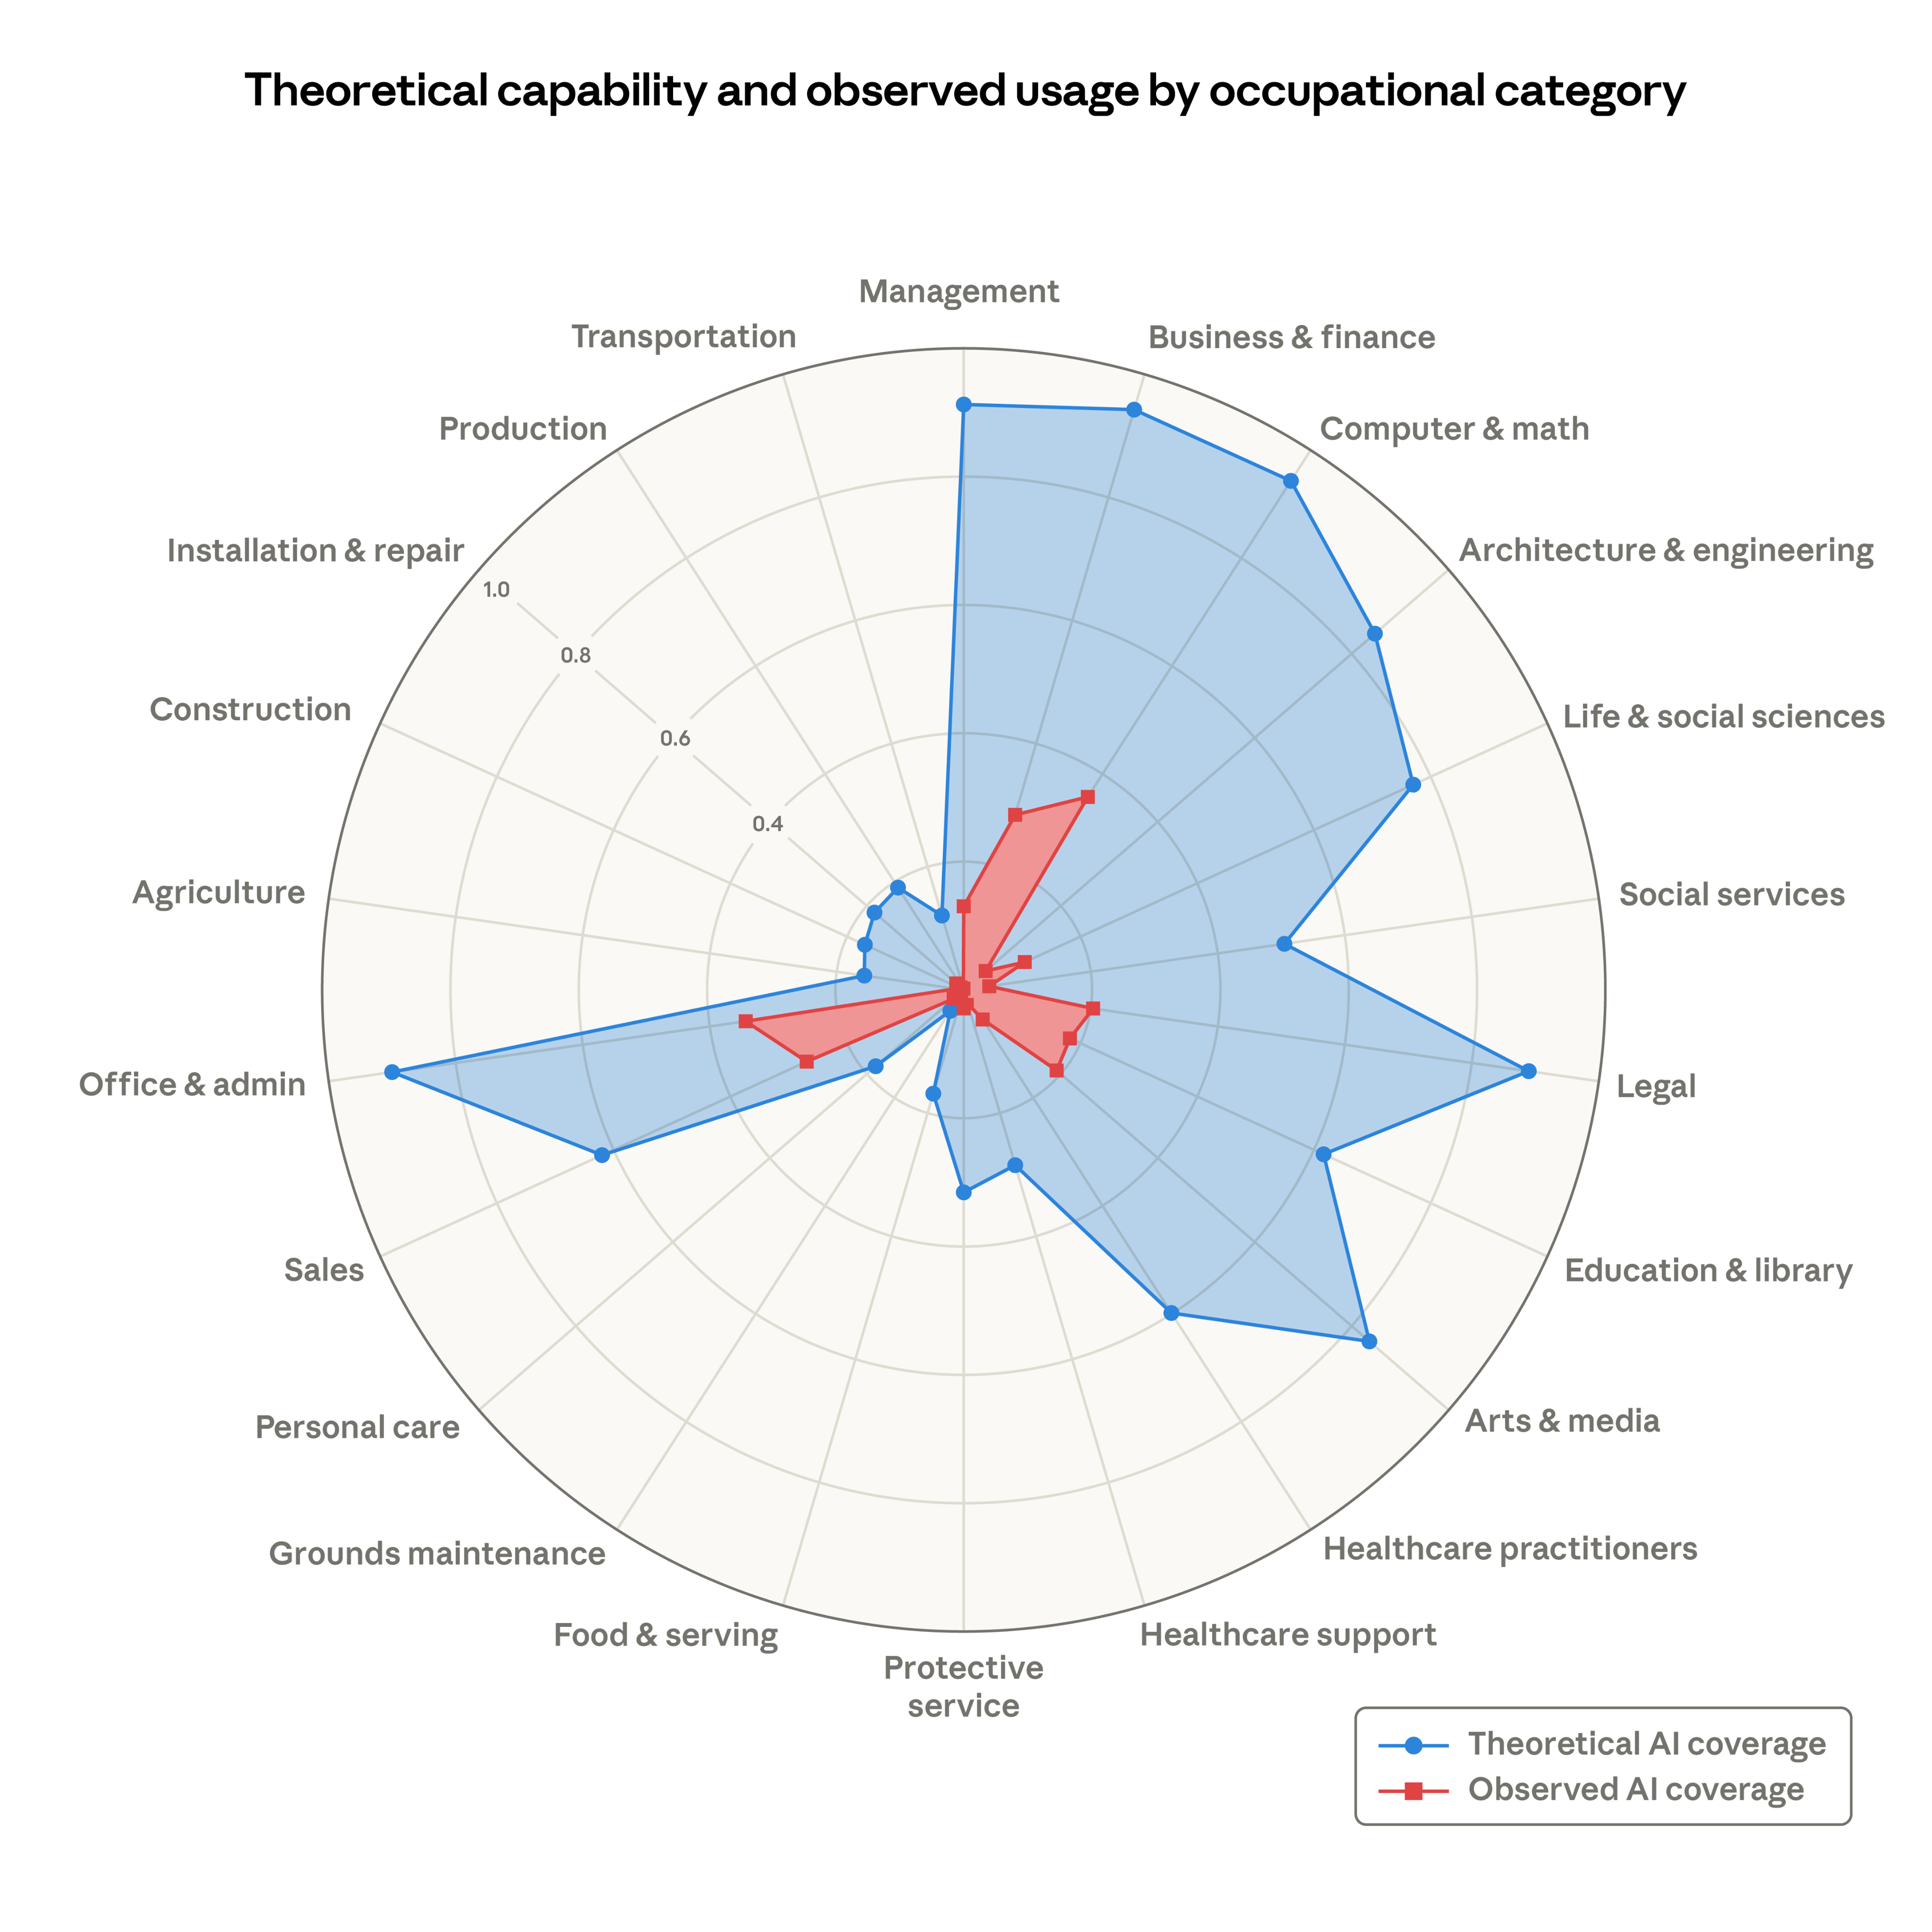
Source: Massenkoff & McCrory (2026), “Labor market impacts of AI: A new measure and early evidence”
How to Read This Data
TL;DR
Think of this like construction permits for AI automation. Before AI replaces tasks in an industry, developers download the tools to build those systems. We track Python and JavaScript package downloads as a leading indicator of where AI automation is heading. When industry-specific tools grow faster than general AI infrastructure, it signals a shift from “people using AI” to “AI doing the work.”
Package downloads do not equal production use. The signal is in relative growth rates across industries, not absolute numbers.
The construction permits analogy
Before a building goes up, construction permits spike in that neighborhood. This page works the same way: before AI replaces tasks in an industry, developers start downloading the tools to build those automation systems. We track both Python and JavaScript package downloads as a leading indicator of where AI automation is heading.
What is the Automation Acceleration Index?
The AAI compares how fast industry-specific automation tools are growing versus general AI infrastructure (like the OpenAI or Anthropic SDKs). When the AAI is above 1.0, it means the tools that automate specific jobs are growing faster than the underlying AI platform — a signal that we're moving from “people using AI” to “AI doing the work.”
What counts as “surging”?
A tool gets flagged as surging if it shows 3 or more consecutive months of greater than 20% month-over-month growth, or if its recent growth rate has at least doubled compared to the prior quarter. These are the tools gaining adoption fastest — and the industries they serve are worth watching.
Community signals
GitHub stars and issues, plus StackOverflow question volume, provide supplementary context alongside download data. Stars indicate developer interest, issues reflect active development and bug reports, and SO questions show how many people are trying to use a tool. These are shown as compact indicators on each tool but are not factored into the AAI calculation.
Important caveats
Package downloads do not equal production use. CI/CD pipelines, Docker builds, and dependency resolution inflate counts. The signal is in the relative growth rates across industries, not the absolute numbers. New tools with small user bases can show extreme growth percentages. And correlation is not causation — rising tool adoption doesn't prove job displacement, but it does indicate where investment and capability are concentrating.
Data sources: pypistats.org (Python packages), npm registry (JavaScript packages), Bureau of Labor Statistics CES (employment data), GitHub API (stars & issues), Stack Exchange API (question volume). Updated monthly.